Carrying out a science IA analysis and the accompanying uncertainty calculations—in subjects like Chemistry, Physics, and Biology (SL and HL)—is one of the most challenging things to get right. Too often, I have witnessed students spending hours upon hours calculating percentage errors, only to find out that they got it all wrong.
In this article, I’ll expand on the previous post on Science IA Communication and Personal Engagement and provide tips for doing well in the Analysis part of your IA. This criterium makes up 6 of the total 24 marks, making it essential to apply these tips if you’re going for that juicy 7!
If you struggle with your IA, you should contact one of our Lanterna expert tutors. They all have extensive experience with the IB’s infamous internal assessments and are ready to help. Read this post for more about how tuition could help you.
Loyal readers will remember that our Science IA Guide likens learning science without experimentation to baking a cake without flour. If we built upon the metaphor and were to compare Communication to frosting and Personal Engagement to the cherry on top, having a solid Analysis section in your IA would be the spongecake base. Well, let’s get baking!
Nailing Your Science IA Analysis
The first half will focus on the Analysis section. Here, I will discuss data sampling, data processing, and, most importantly, uncertainty calculations. The Analysis you present is the heart and soul of your Internal Assessment, so don’t neglect it!
How much data is enough data?
It might not seem very pleasant when your teacher tells you to run the same titration five times for five different concentrations for your Chemistry IA (SL or HL), but there is a good reason for it! The “5 by 5″-rule is the golden standard for science IAs, and you should do your best to live up to it!
Let us say that you’re writing your Biology IA on the effect of K+-ion concentration on the growth rate of mentha piperita. In this example, you would want to test at least five different K+-ion concentrations with at least five plants per condition.
The reason for this is simple. The IA Criteria require “sufficient relevant quantitative and qualitative raw data that could support a detailed and valid conclusion to the research question” for a high mark.
You should also note down everything that happens in the lab and take plenty of pictures! You want to store as much information as possible during your lab work and decide what is useful later. Nothing is worse than noticing you forgot to measure something once you start data processing.
Qualitative vs Quantitative Data in your IA Analysis
Note that the above quote requires quantitative as well as qualitative data. Quantitative data comprises measurable aspects such as weight, height, and speed, while qualitative data refers to observations that cannot be quantified (hence, it isn’t quantitative). For instance, if you notice a colour change during one of your experiments, you can include it in a “quantitative data” subsection and explain what that alteration might signify.
If you want to be nice to your examiner and thus make it more likely that they are nice to you, present your quantitative data in a pretty table and/or graph. Showing your data nicely is integral to communicating well. If you want more Communication tips, read this post.
Data Processing in Your IA Analysis
It’s time to slip out of the lab coat and into something more comfortable because you’re about to spend a lot of time in front of a screen. Sound data processing and uncertainty calculations take time, especially if it’s your first time working with them. It is time well spent, though! Data processing skills are useful even if you’re not planning to pursue a science degree. IA Analyses provide an opportunity to improve written communication, a crucial skill in every industry.
What follows are top tips from our tutors on what you mustn’t forget when processing your raw data.
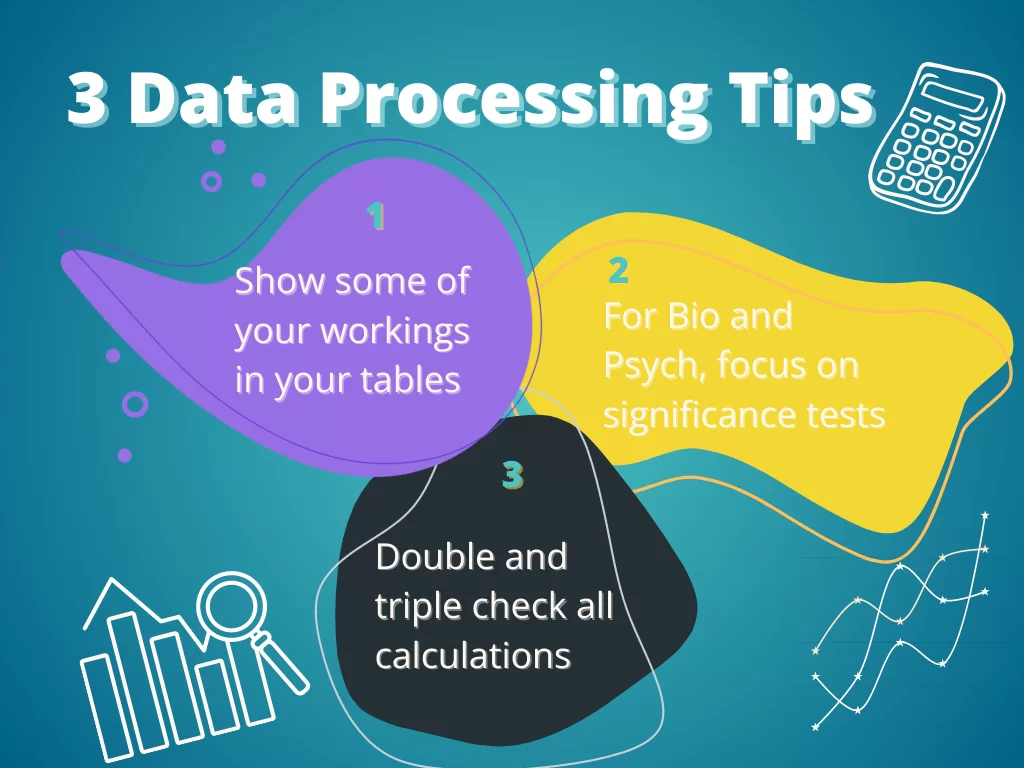
Data Processing Tip 1: Show Your Workings

Whenever you write a number or value, ensure the reader knows where it came from. This doesn’t mean you need to show absolutely every calculation you perform, as there simply isn’t space for that. If you repeat calculations, you can show just one, but you mustn’t avoid them altogether. The table here is an example of this from my Chemistry Extended Essay. Click here for some killer EE advice!
Data Processing Tip 2: Significance Testing
Significance testing is typically only necessary for Biology and Psychology IAs (SL and HL). Therefore, I’ll keep this section relatively short and, instead of giving you an in-depth explanation, simply remind you that it is vital to get it right. Let this quote from our IB Psychology IA blog post inspire you:
“Most of the time, the statistical test will do most of the heavy lifting for you. All you have to do is state which one you’ve chosen and why, and using the number it spits out, choose to accept or reject your hypothesis. The words’ statistically significant/insignificant’ are your best friend here!”
Data Processing Tip 3: Double Check Your Calculations
You’ve probably heard the advice to have someone proofread your IA countless times and for good reason. I’ll mention it again: it’s crucial to have someone double-check your calculations to catch any silly mistakes that may have slipped by unnoticed. Don’t take any chances, and ensure the accuracy of your report by asking for help.
Uncertainty Calculations in Your IA Analysis
Here comes the big one: uncertainty calculations and their propagation. A good scientific IA “shows evidence of full and appropriate consideration of the impact of measurement uncertainty on the analysis,” according to the guidelines. Part of the “impact of measurement uncertainty” is how they propagate (i.e., evolve) to become the final uncertainties of your results.
However, before we talk about their propagation, let’s talk about our base measurement uncertainties.
How do I know my uncertainties in the lab?
Fortunately for us, the fundamentals of uncertainties are relatively straightforward to comprehend. If you measure with something analogue (say a graduated cylinder or a ruler), the uncertainty is half the smallest increment on the equipment. If you measure 52 mL with a cylinder with 1 mL spacings, your error is ±0.5. We call this absolute uncertainty.
If you measure something with a digital piece of equipment, like a digital scale, your uncertainty is the smallest increment. If your scale measures 0.2002g of a substance, your absolute uncertainty must be ±0.0001g.
Now, let’s propagate them!
Understanding uncertainty calculations
Imagine you wanted to mix that 52 mL ± 0.5 solution with another 48 mL ± 0.5 solution. The resulting mixture would, of course, have a volume of 100 mL (unless it doesn’t). Since you found this new volume by adding two numbers, you can find the error by just adding up their absolute uncertainties, such that:
0.5 + 0.5 = ±1
Thus, your final volume would be 100mL ± 1.
Suppose you want to dissolve the 0.2002g of a substance in your new solution to calculate its concentration in g/mL. What would the uncertainty be? This is where it gets more tricky. I will leave this as an exercise to you, as an in-depth explanation would take up too much space. Try and see if you can solve it with this video!
You should include your final uncertainties as error bars if you use graphs, and consider them when writing your conclusion!
Interpreting Your Processed Data in Your IA Analysis
After analyzing your raw data, it’s important to interpret it honestly without altering it to fit your hypothesis. Explain any trends or lack thereof and provide reasons for them. Don’t worry if there are high uncertainties; just make sure to explain how they could be improved in future research. Honesty is critical and will be what gets you high marks.
It might seem daunting, but doing an excellent job of processing and presenting your data can be done, and hopefully, these tips have inspired you to try your best!


